Long-term variation in the cloud-tracked zonal velocities at the cloud top of Venus deduced from Venus Express VMC images
The super rotation of Venusian atmosphere is the main target of the Venus Climate Orbiter AKATSUKI, which has been existing for more than 40 years since its discovery and has been thought to be a very stable phenomenon. Despite the stable existence of the super rotation, it was reported that the westward wind speed of 100 m/s, the origin of the name "super rotation", did not keep its speed at 100 m/s, but it varied more than 10%, based on the observation of NASA's Pioneer Venus mission. It's unknown whether the wind speed variation is regular and periodic, which may represent how atmospheric momentum is exchanged in Venusian atmosphere. To understand the current state of super rotation and investigate the momentum transportation, it is important to observe the wind speed of the super rotation continuously.
In this research, we investigated the long-term variation of zonal wind (westward wind) at the cloud top by estimating the wind speed from the motion of clouds in the ultra-violet images taken from 2006 to 2010 by the Venus Monitoring Camera (VMC) onboard ESA's Venus Express. An automated cloud tracking technique was used to derive cloud motion vectors from these images. Hereafter, we use the term "wind speed" with the assumption that speed of cloud motion is equal to that of wind, though it is not considered as always true. There were 7 epochs in which VMC observed dayside of Venus from May 2006 to March 2010. Short-term variation is investigated by analyzing the data obtained during each epoch one by one, and long-term variation of super rotation is investigated with an ensemble of the data obtained during the 7 epochs.
From previous works, it has been known that wind speed strongly depends on local time (the time is defined so that the rotation period of Venus is 24 "hours" and local solar culmination time is 12:00). Since the effect of the local time dependence should be distinguished from actual wind speed variation, we selected data obtained at local time only between 12:00 and 14:00 so that we can reduce the effect of local time dependence. Some noticeable variations were found in both long-term and short-term variations of wind speed measured in 5 latitudinal bands in the south hemisphere (Fig.1). That are, variations of zonal wind with amplitudes of 20 - 30 m/s and periods of 4 - 6 earthdays, and that of zonal wind with amplitudes of ~20 m/s and periods of several hundred earthdays. As for the meridional wind, in addition to the variations with periods of 4-6 earthdays similar to zonal wind, there exist periodic variations with amplitudes of ~ 8 m/s uncorrelated with zonal wind.
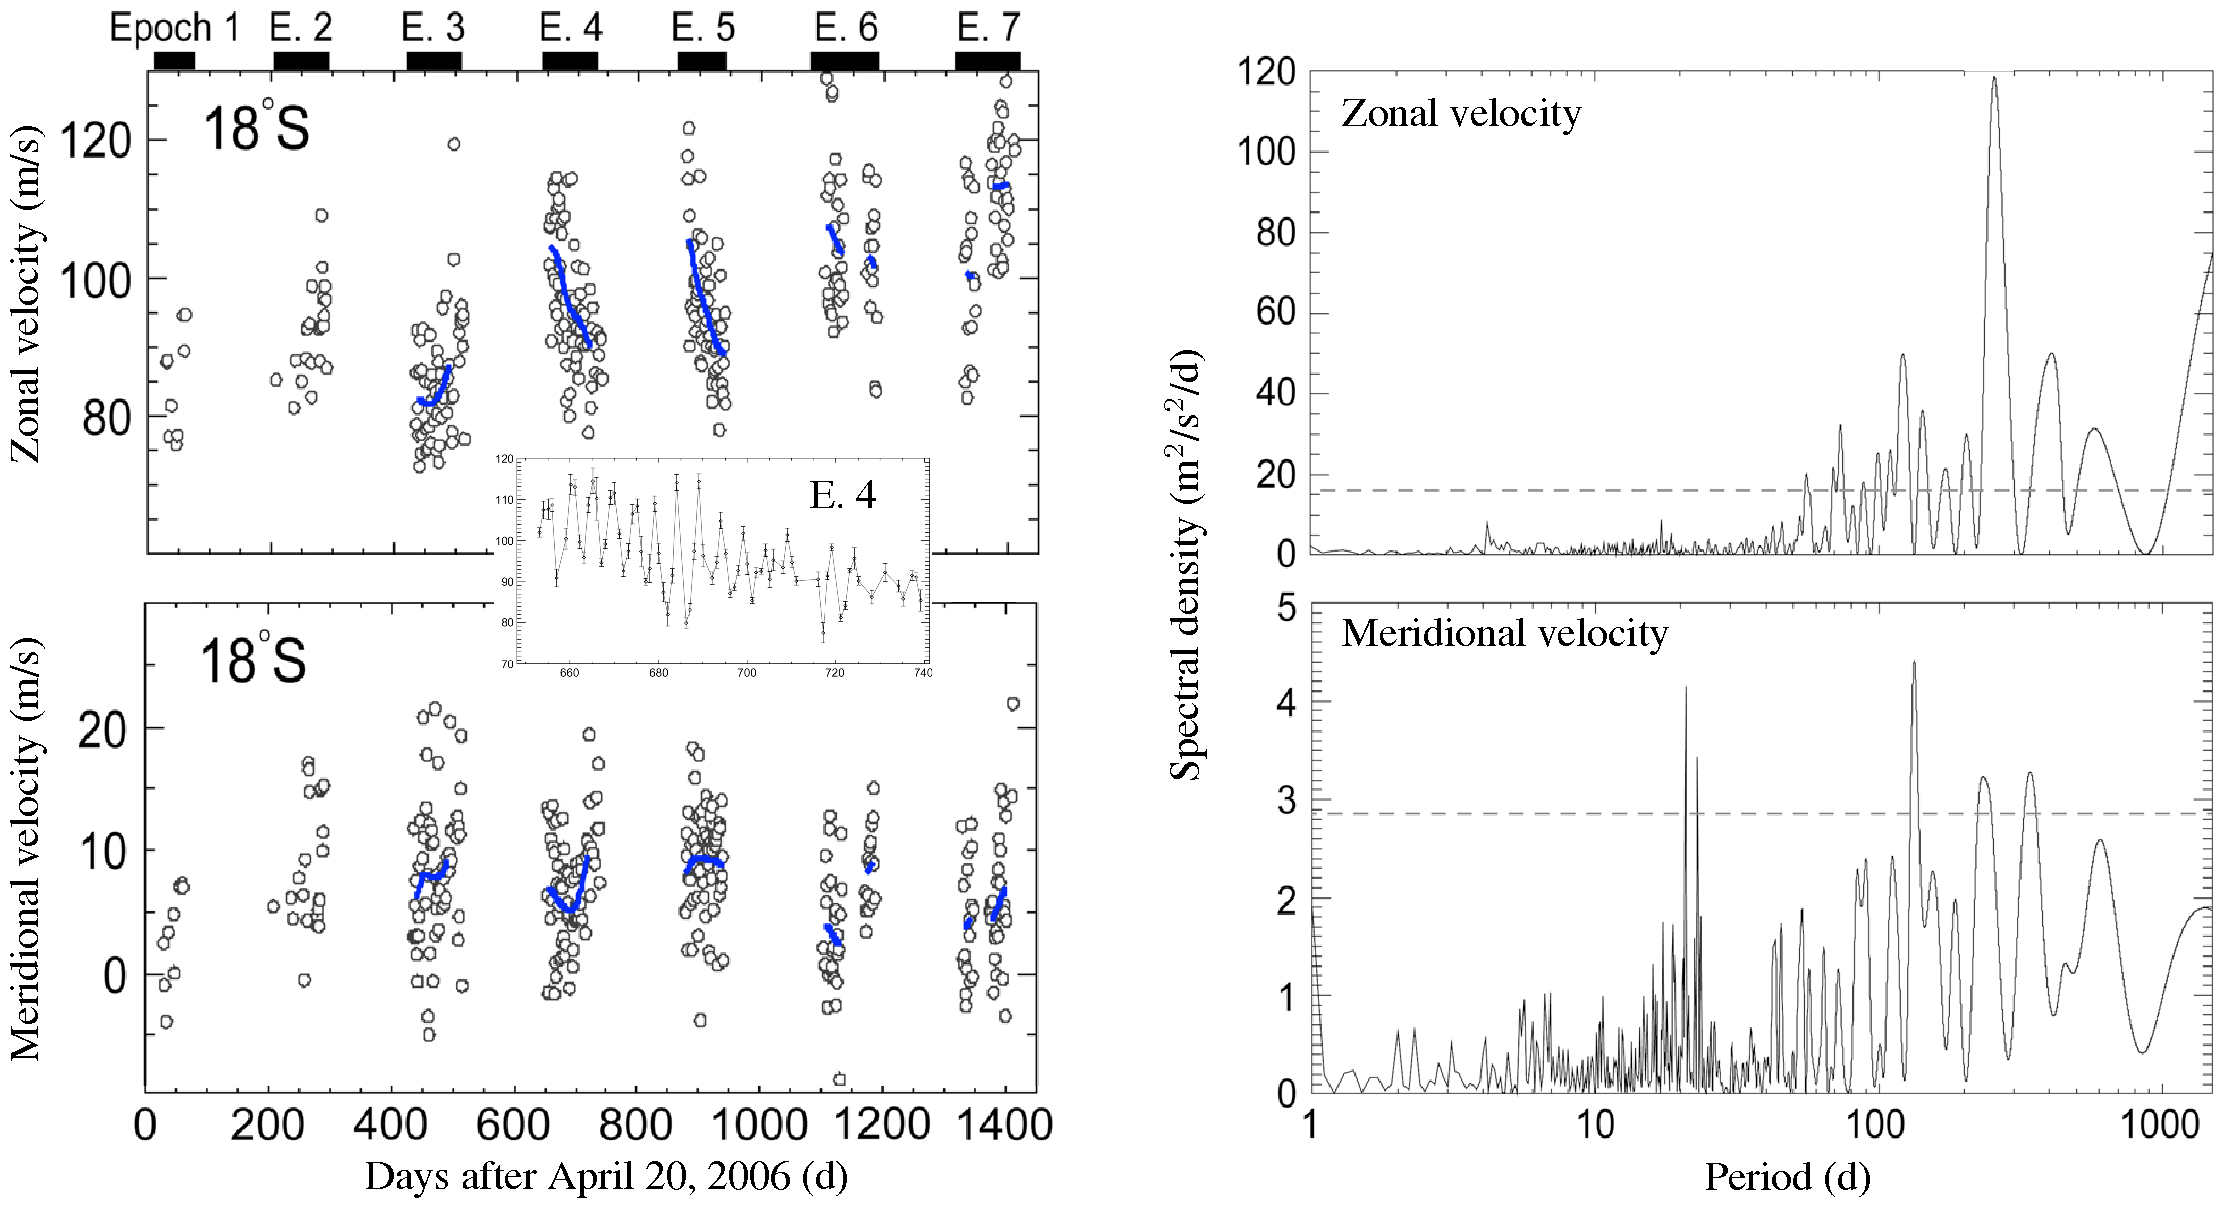 Fig.1: (left) Temporal variations of zonal velocity from May 2006 to March 2010 at 18°S averaged in the local time range of 12:00 - 14:00. The horizontal axis is earthdays after April 20, 2006. Epochs from 1 to 7 are periods when VMC observed Venus at local time between 12:00 and 14:00. Open circles represent zonal velocities on each day and blue curves are long-term variations extracted from the data. The 4 - 6 earthday oscillation can be seen in the central inset which shows zonal velocity during epoch 4 in detail.
(right) Power spectral density of zonal and meridional velocities at 18°S obtained by a periodogram analysis. The levels of 99% statistical significance are also shown (dashed line). In the zonal velocity, a peak around 255 earthdays can be seen separately from the peak around 225 earthdays (1 Venusian year = the period of Venus's rotation around the Sun). The absence of signatures of the 4 - 6 earthday oscillations is attributed to the variation of the periods from epoch to epoch.
The periodicity of zonal and meridional velocities is further studied using periodogram analysis (a method to obtain periodic component from data with unevenly-sampled intervals, i.e. a kind of periodic analysis). First, we investigated periodicity of wind speed over long span. The zonal velocity spectrum exhibits a prominent peak at a period of ~255 earthdays from low to mid-latitudes. This amplitude of the variation is larger at lower latitudes. The phases of the variation correlate in the low latitude. The meridional velocity has some peaks, but they are too weak and statistically not significant.
Atmospheric flow on a planet is affected by various waves traveling in the atmosphere, such as so-called Kelvin wave and Rossby wave. Such waves accelerate or decelerate the flow when they are generated or broken. The variation of ~20 m/s over 100 earthdays obtained in this research is consistent with the values estimated in previous studies.
Next, to monitor activities of such waves, we investigated the short-term variation of wind speed and discussed on the 4-6 earthdays variation, as well as its relationship with the background winds. We performed the periodogram analysis on each epoch, and the 4-6 earthday oscillations were found in specific latitude ranges in some epochs. Fig. 2 shows colormap of power spectral density (intensities of oscillations) of zonal and meridional velocities obtained in epoch 3 and epoch 6 as functions of latitude.
As for the relationship with the background wind, since the background winds were slower during epoch 3 compared with other epochs, we classified epoch 3 as a slow background wind period and other epochs as fast background wind periods. Then, we investigated the difference of the periodicities of the two in detail. Interestingly, it is found that there exists an equatorial Kelvin wave-like oscillation in the slow background wind period, and there exists a Rossby wave-like oscillation in the fast background wind period (epoch 4, 6, 7) except for epoch 5. Since Kelvin waves transport positive (i.e. the same direction with the background wind and can accelerate the super rotation) momentum from lower to higher altitude and Rossby waves work in the opposite way, it is expected that these waves contribute, at least partially, to the periodical oscillation of zonal wind.
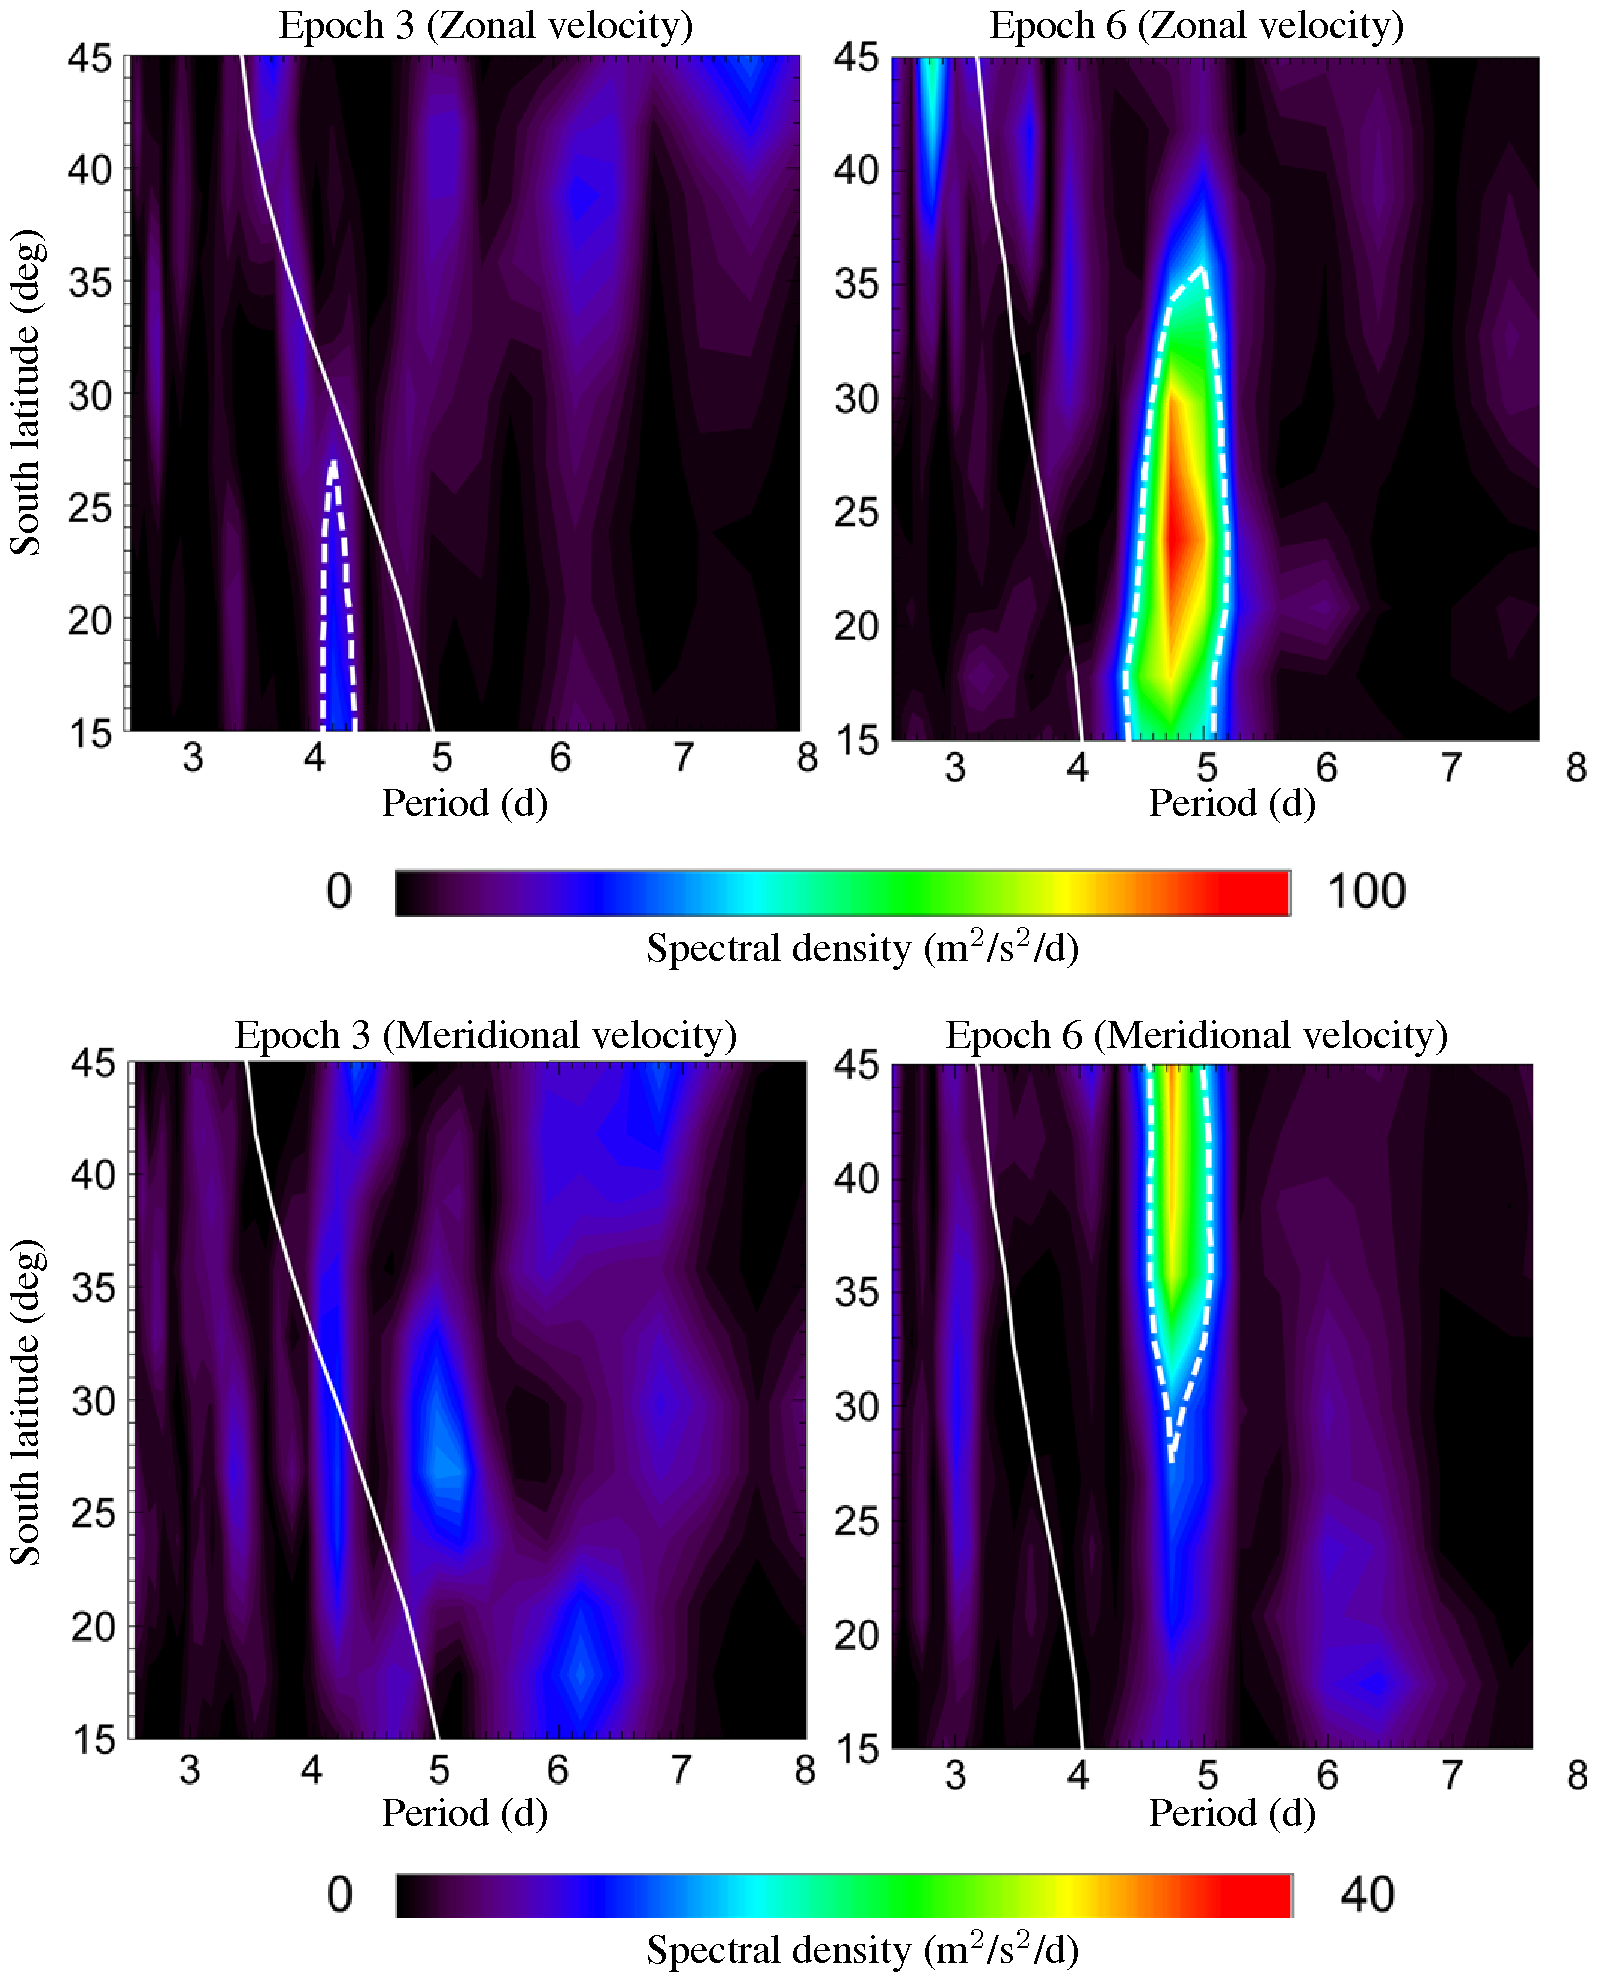 Fig.2: Power spectral density of zonal and meridional velocities as functions of latitude in each epoch. Colors and dashed contours represent power spectral densities and the 90% statistical significance level, respectively. White curves represent rotation periods of background zonal wind around Venus as functions of latitude. In epoch 3, there exists a zonal oscillation faster than the background wind in the low-latitude, while there is no significant meridional oscillation. On the other hand, in epoch 6, there exists a zonal oscillation slower than the background wind in the middle and low-latitude, as well as meridional oscillation slower than the background wind in the mid-latitude.
These research results are reported in Kouyama et al. "Long-term variation in the cloud-tracked zonal velocities at the cloud top of Venus deduced from Venus Express VMC images" and appear in the Jan 2013 edition of Journal of Geophysical Research: Planets.